Consequences of Selecting 2D and 3D Geometries for Modeling Thermal Bridges
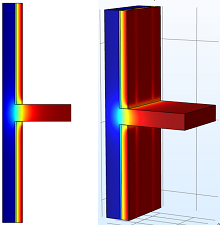
COMSOL® has been used to compare 2D and 3D model results to quantify what simplifications can be made when modeling thermal bridges. Currently there are suggestions put forward as to when it is appropriate to use 2D vs 3D models to capture the effects of thermal bridges. It is known that 2D and 3D models can be used effectively to model select parameters of thermal bridges, however when geometric and material simplifications are made in order to reduce computational requirements, select parameters may not be appropriately represented. These geometric and material simplifications can lead to a misrepresentation of select parameters if not considered in model design, specifically when studying minimum surface temperatures when considering condensation and mold growth. This study has found that when studying a façade for minimum temperatures in the wall from thermal bridging, using effective thermal resistance values for studs and insulation does not produce the same results as compared to modeling the two materials and geometries separately. In order to quantify this, stud wall configurations were created in both 2D and 3D with a combination of stud configurations and effective thermal resistances. The Heat Transfer in Solids interface was used to analyse the results under steady state conditions. The models were analysed with external and internal ambient temperature of -20 ºC and 21 ºC respectively and boundary conditions as specified in ASHRAE Fundamentals. The geometries and testing procedure followed the specifications as outlined in ISO 10211:2017, with the exception of when simplifying material properties and geometries can be conducted to prove the hypothesis. An example of one of the tests performed can be seen in Figure 1, where an internally insulated concrete mass wall with vertical steel studs 16 inches on center was modeled in 2D on the left using an effective thermal resistance for the vertical studs compared to the 3D geometry on the right where the vertical and horizontal steel studs were modeled separately from the internal insulation. The results of the 2D vs 3D comparison shown in Figure 1 will indicate which geometry has the lower minimum surface temperature where a small difference could be the difference between condensation and mold growth forming within the wall. The outcome from these results is to provide more information as to when it is appropriate to use 2D vs 3D modeling and when material and geometric simplifications can be made when studying thermal bridges.